Overview
DMF (DANZ Monitoring Fabric) for short, is a software that Arista Network acquired that specializes in building a network that allows for the users to monitor, detect, and troubleshoot any problems related to their network. CloudVision, however, Arista’s flagship product, specializes in the onboarding and management side of maintaining a network, with less focus on troubleshooting tools.
As a result, the rational of integrating features from one to another is logical in the progression of assisting the existing Network Administrator user-base in maintaining and monitoring their network as simple and efficient as possible.
Restricted Information
Due to the nature of the redesign, I am unable to publicly share the entire design process of the project. If you would like to learn more about this project and the design process, please reach out to me.
Release Date
This project was released for as a beta for Arista users as of mid-2024.
My Role
UX Designer
As the sole UX designer, I was in responsible for the creative direction, from user research and concept development to prototyping and implementation. I also worked closely with cross-functional teams, including product managers, developers, and stakeholders, to create a collaborative and inclusive design process.
Tools Used
Figma and Adobe Illustrator were primarily used throughout the design process.

The Scope
The goal of this project is to integrate the features of Recorder Node from DMF into CloudVision, ranging from onboarding, initializing and creating recording sessions, to documentation and dashboard statistics, to querying for debugging and troubleshooting purposes.
Recorder Node (RN)
A feature of DMF that allows users to record and analyze all packets that are deemed important to a network.
Arista’s CloudVision
A network management product that provides high visibility into how a network is performing.
Recorder Node Analogy
A common analogy in an every-day use case would be the use of security cameras, recording high-traffic areas to understand issues should a problem arise. A similar premise is used for Recorder Node; users would identify high-traffic devices, and record all packets that gets transmitted through it, and can later query the recorded data for troubleshooting purposes
Dashboards
Dashboards created to monitor the health and status of the Recorder Node Device.
Query Workflow
Below are snippets of the Querying workflow, allowing users to identify details of traffic within a specific time range, and within their specifications.
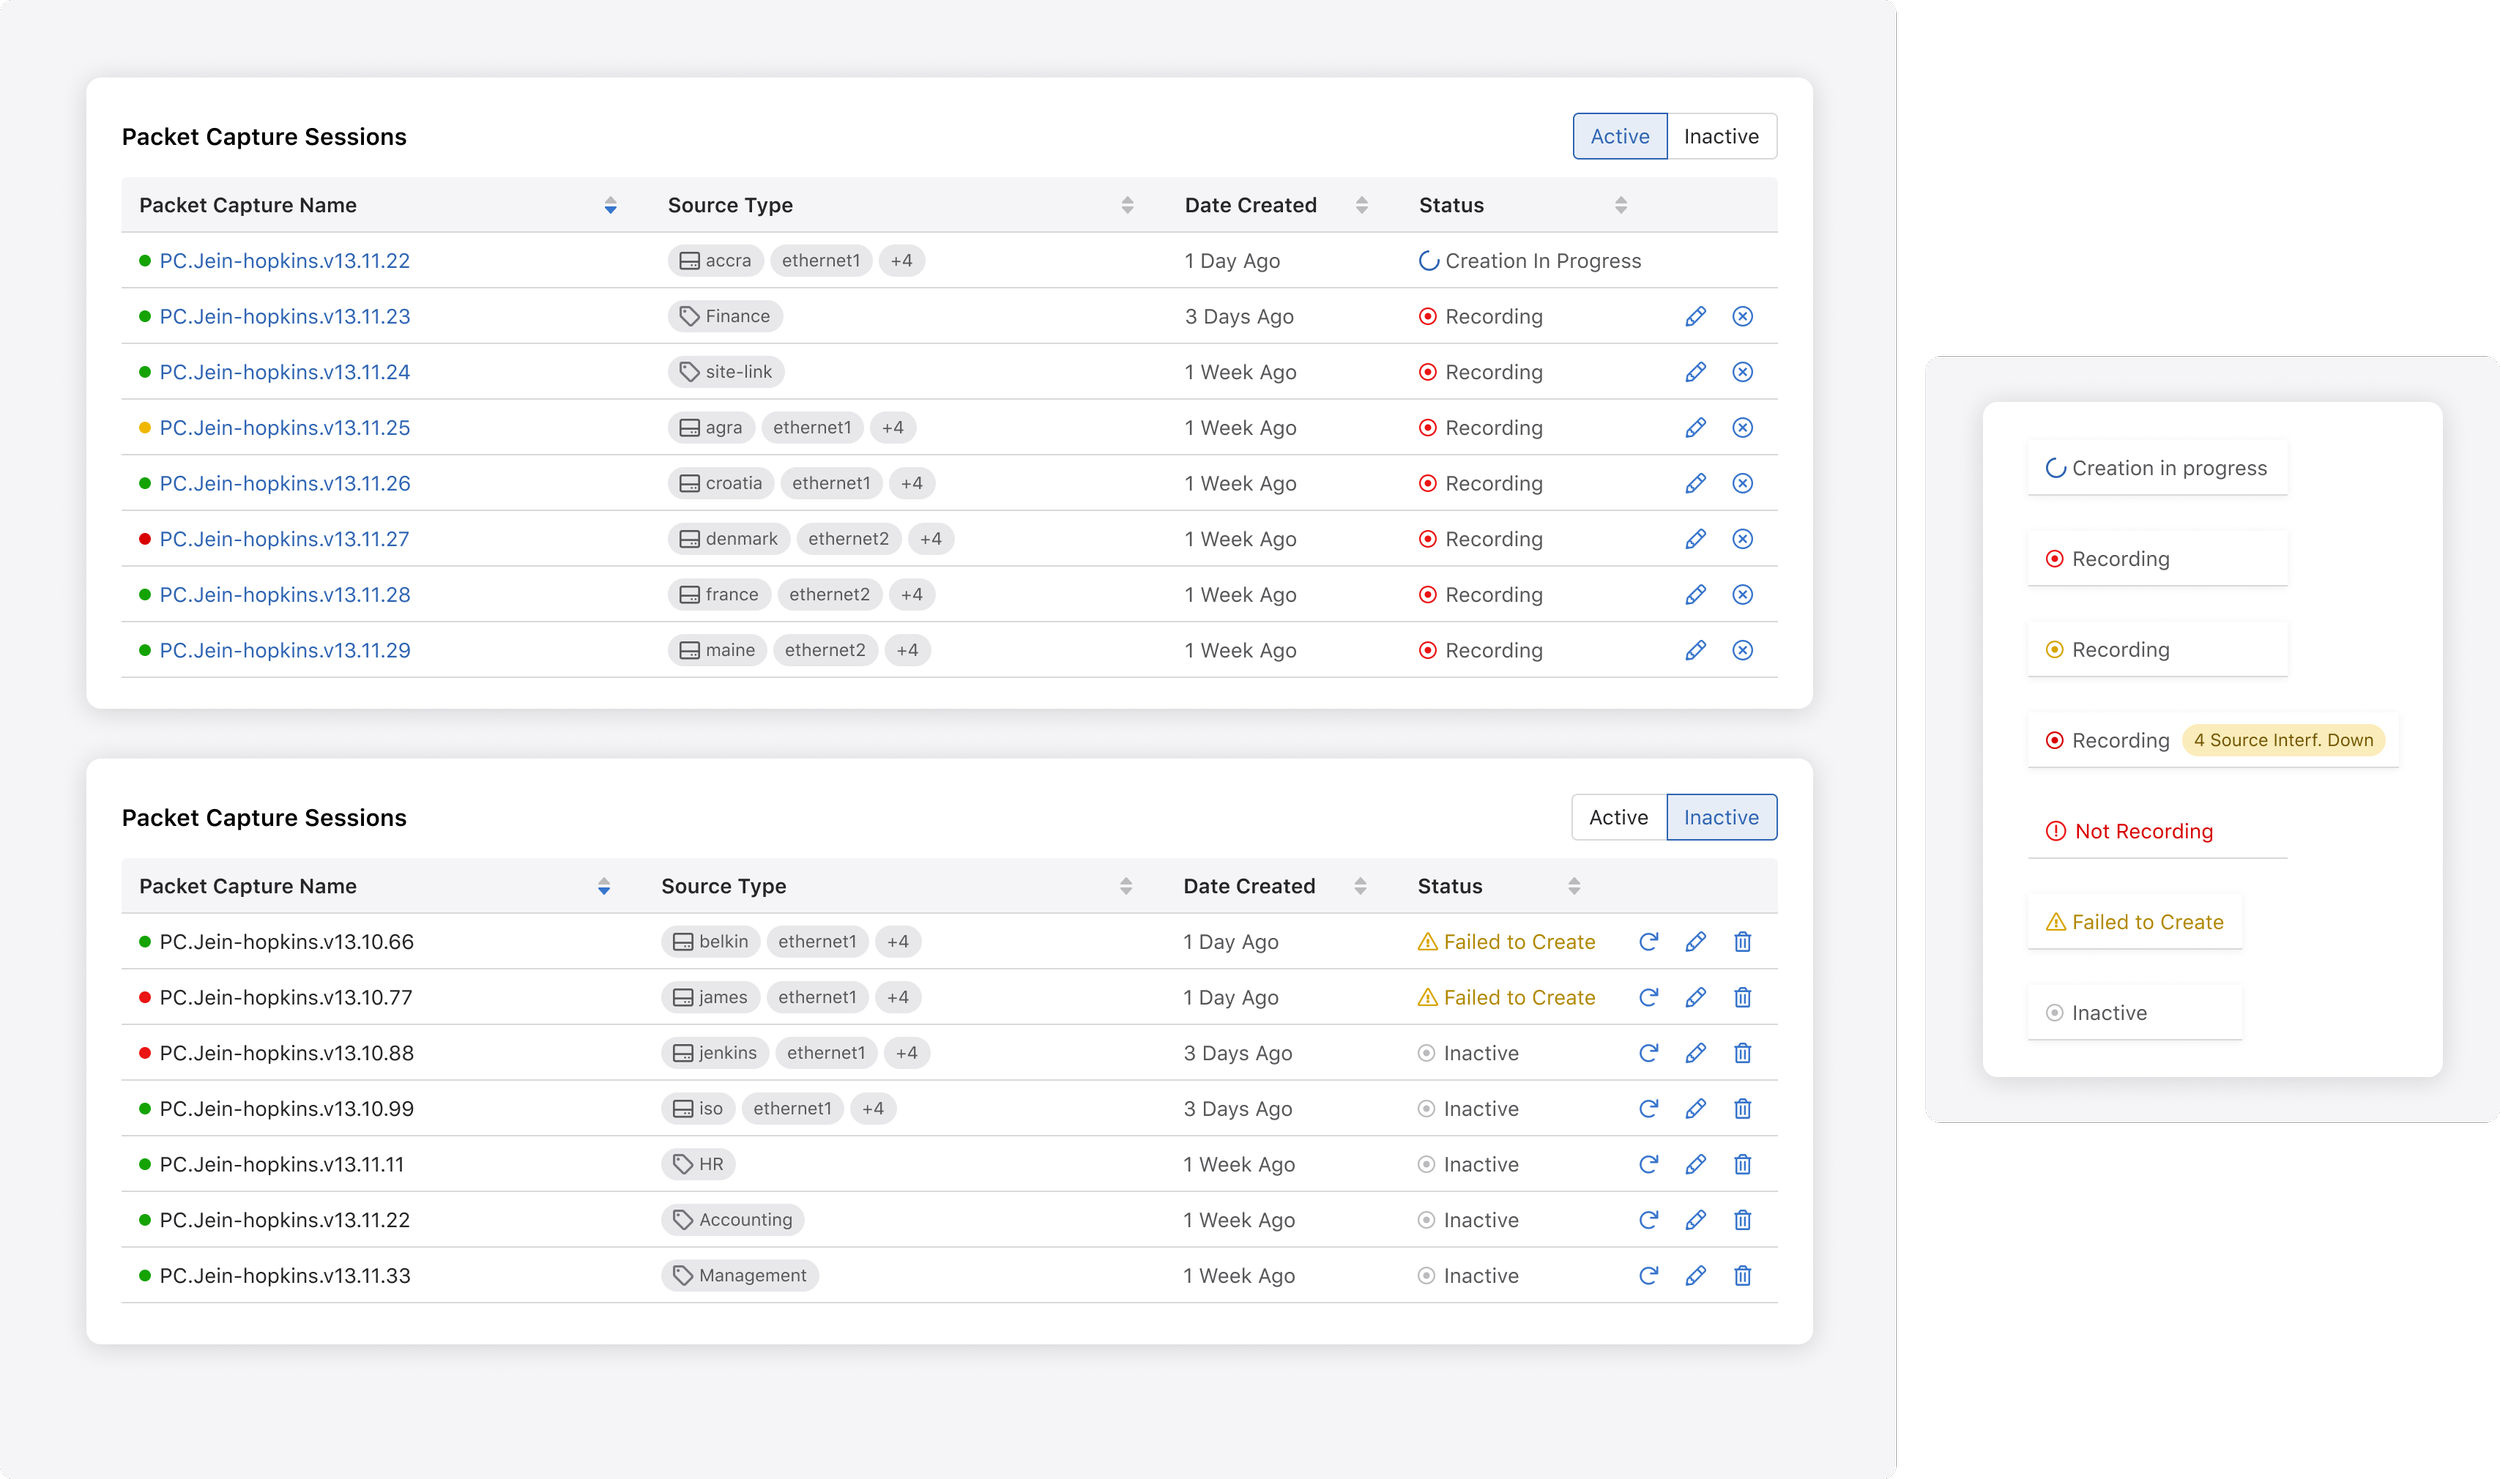
Capture Session
Below are snippets of the Packet Capture Sessions, highlighting the status of each device being recorded and other essential details.