
The Project
In any given network, thousands of things can go wrong at any moment, ranging from minor issues like a slightly overactive CPU fan to critical failures such as a complete device outage. CloudVision helps users manage and detect these issues by providing a system for managing Events, alerts that highlight potential issues in the network. Users are able to set custom parameters for each event, allow them to prioritize urgent problems while filtering out less critical ones. This allows users to quickly identify which parts of their network need immediate attention and which can be addressed later.
Restricted Information
Due to the unreleased nature of the redesign, parts of the final mockups have been modified to protect sensitive data and information. If there are further questions regarding my work, feel free to send me an email.
Release Date
N/A
Role - UX Designer
UX Designer
As the sole UX designer, I was in responsible for the creative direction, from user research and concept development to prototyping and implementation. I also worked closely with cross-functional teams, including product managers, developers, and stakeholders, to create an collaborative and inclusive design process.
Tools Used
Figma, Illustrator
Project Goals & Objectives
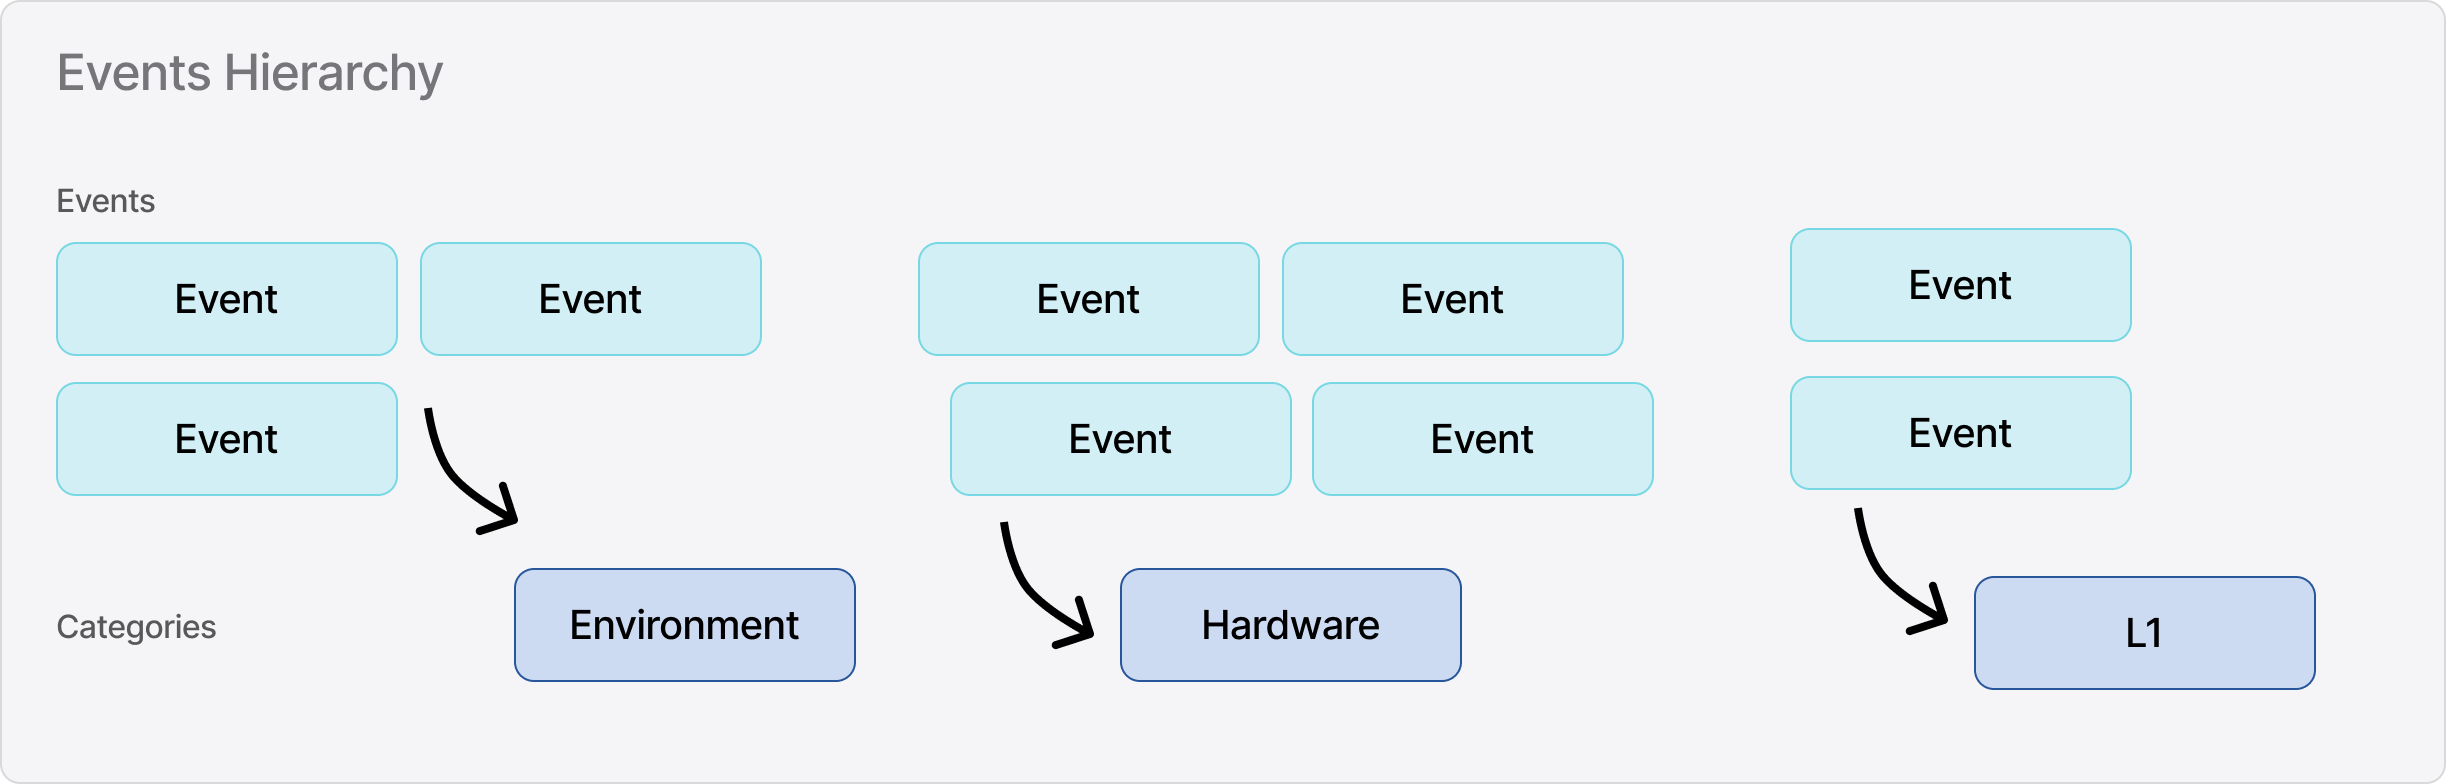
The goal of this project is to create a system that categorizes network events, assisting users to quickly identify which aspects of their network require critical attention. By organizing events into clear categories—such as Hardware, Environment, and Layer 1 (L1)—CloudVision allows users to easily distinguish between physical issues and network-related problems. This structure enables more efficient troubleshooting, helping users prioritize actions based on the severity and nature of the issue at hand.
User Flow & Context
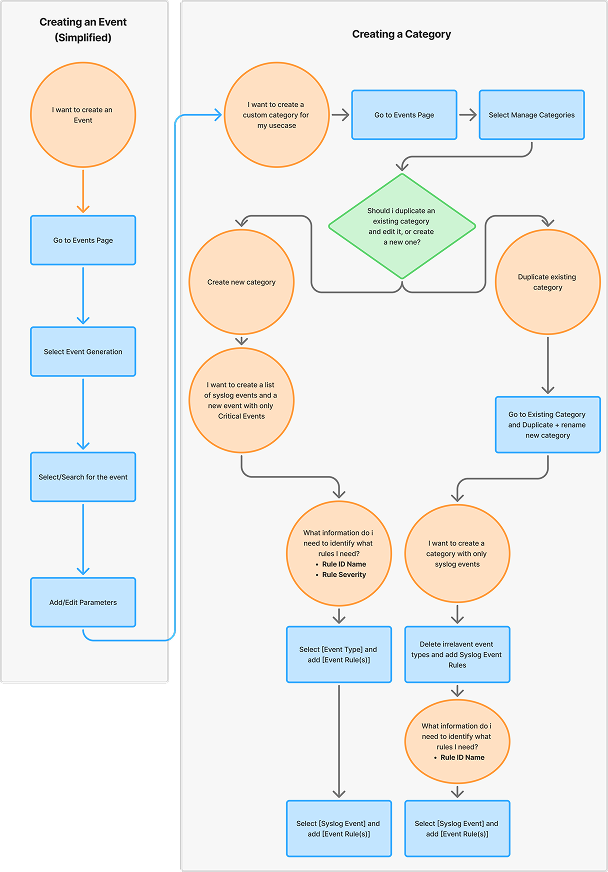
Before users begin creating custom categories, they first need to generate Events—defining what types of network behaviors should be tracked and alerted. While the Event creation flow was not part of my design scope, it's a critical step that informs how and why users organize these Events into categories.
The journey map below outlines the full end-to-end flow, from Event creation to Category setup. The right side highlights the Category creation process I worked on directly, including key decision points and how users tailor categories to fit their specific monitoring needs.
Information Architecture
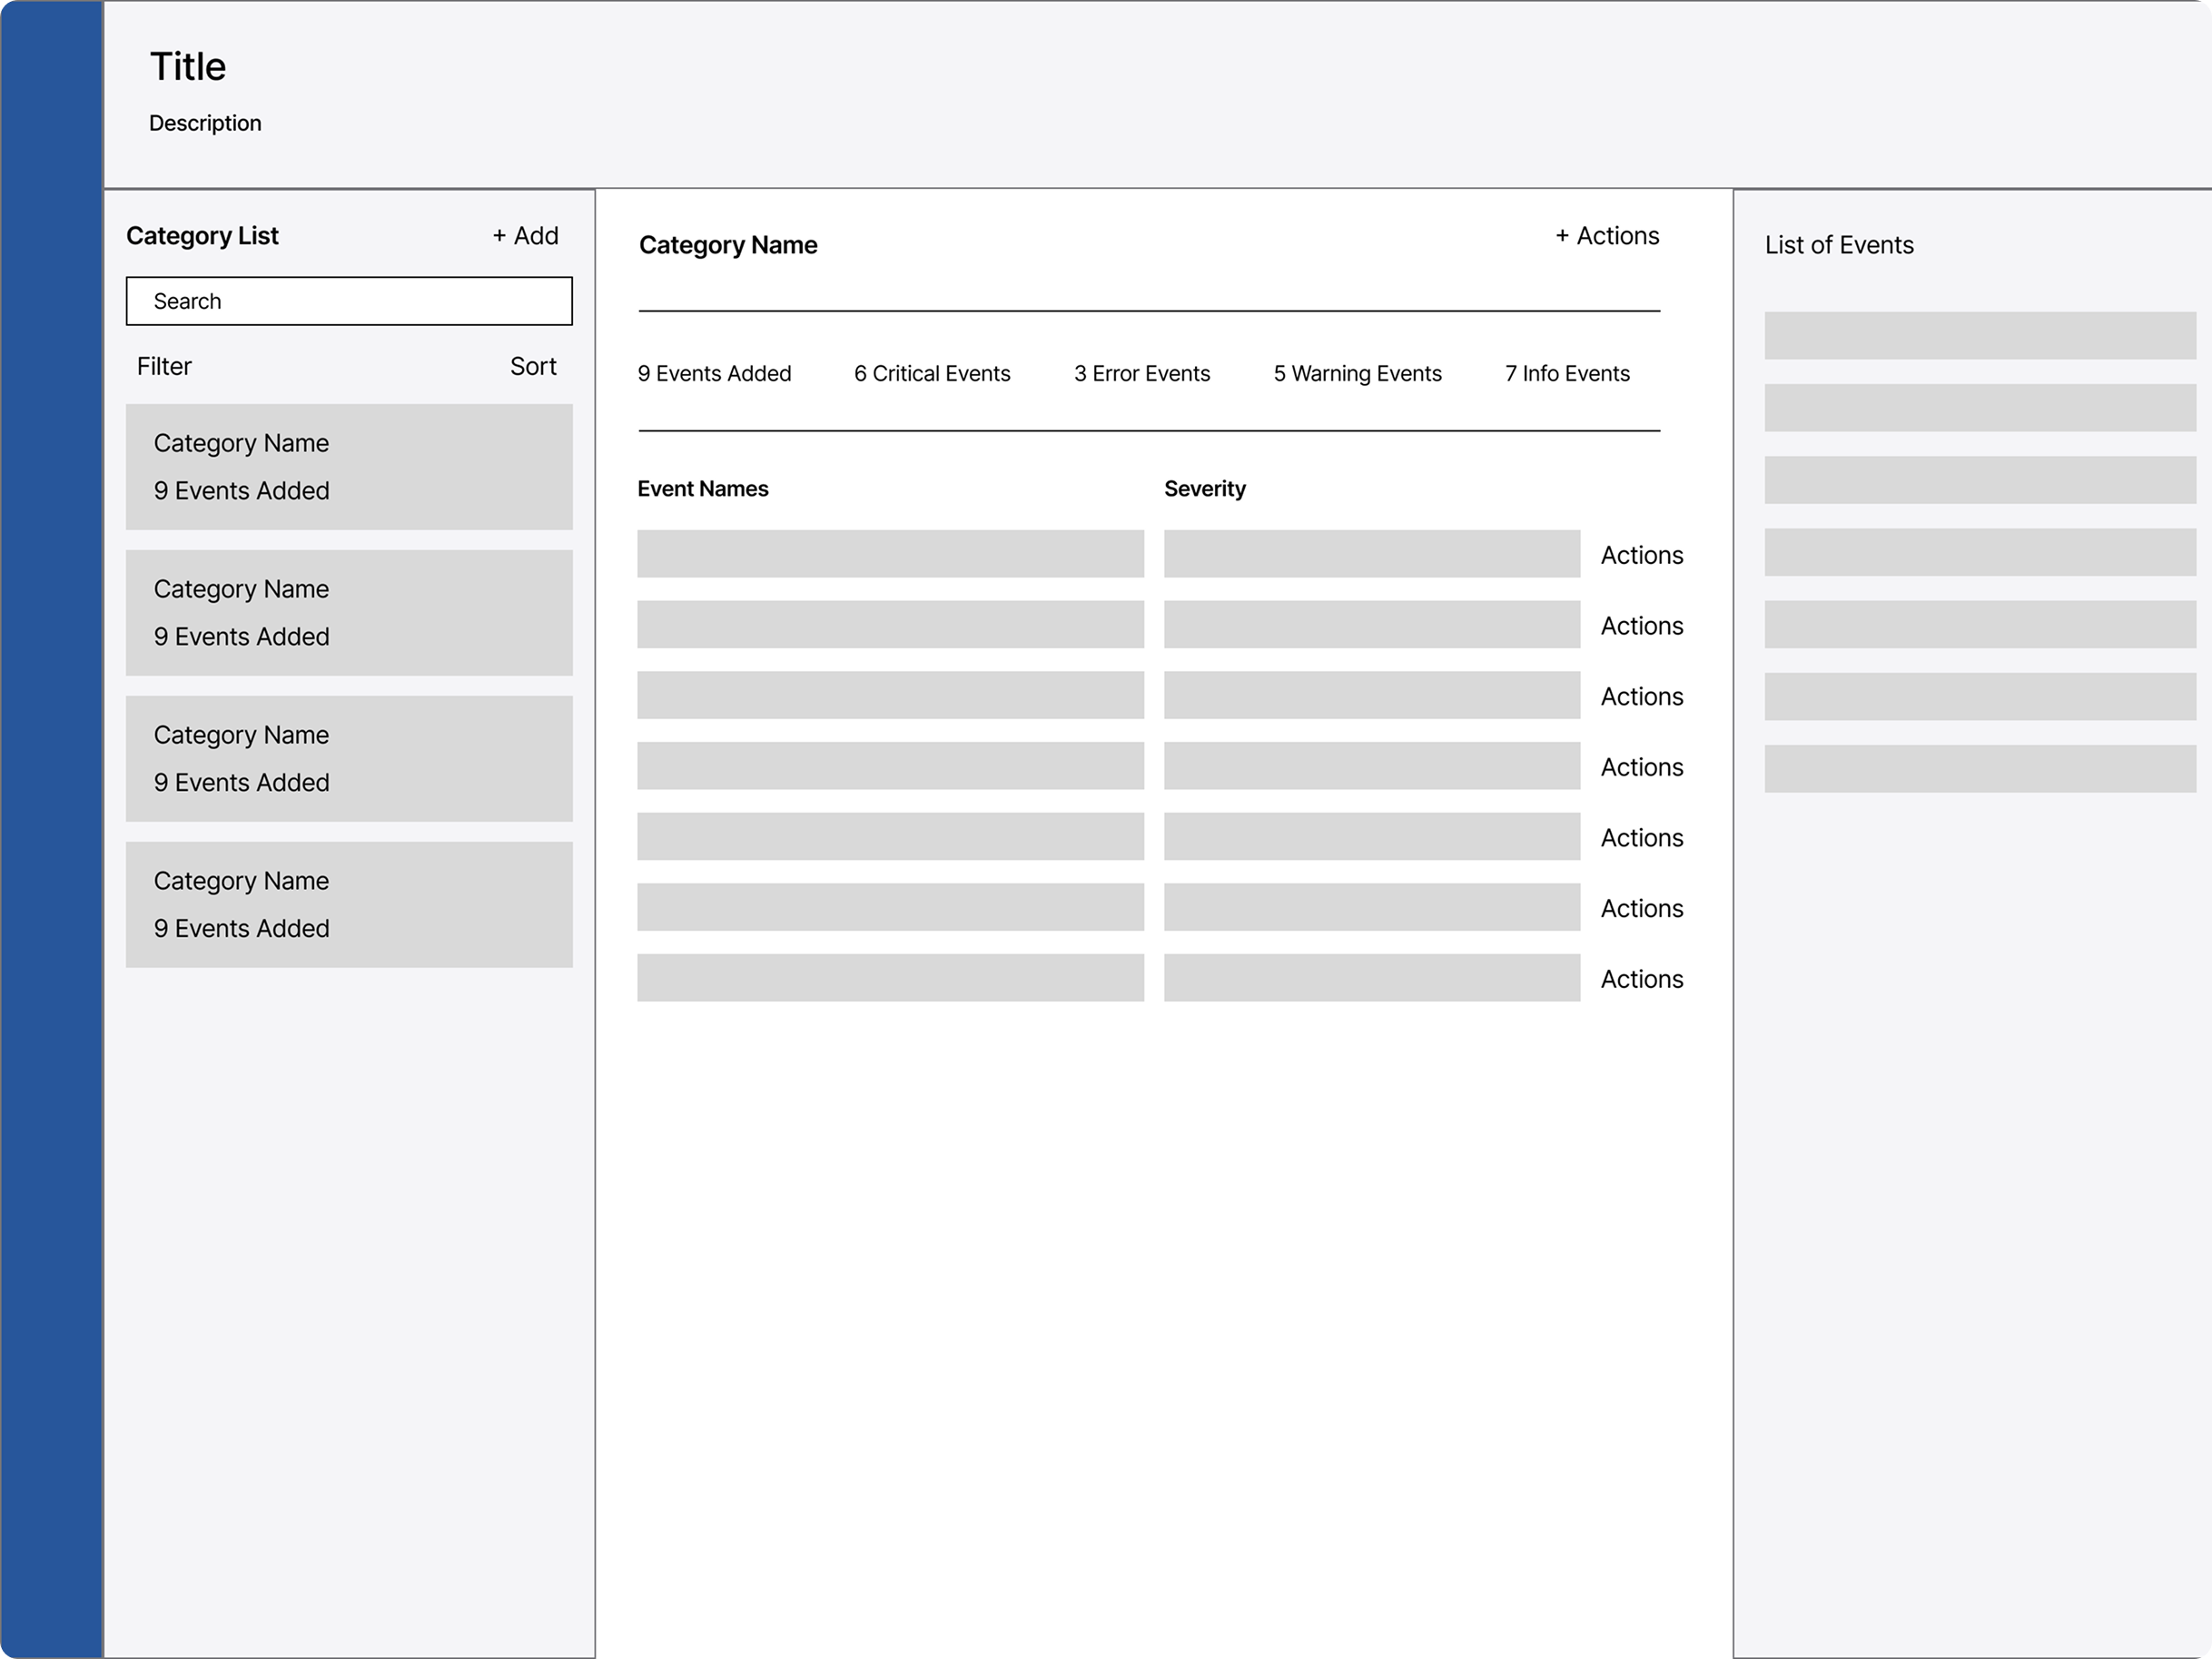
The three-column grid layout was proposed early and retained throughout the design process to stay consistent with similar workflows across the product. While the overall flow of this feature was relatively straightforward, we placed strong emphasis on refining the information architecture.
Much of the iteration focused on deciding what information was essential to display and what could be omitted to reduce cognitive load. One key example was the summary of severities in the center column. Although initially included, we ultimately removed it based on findings from user research—it introduced unnecessary complexity and wasn’t considered a meaningful factor for users when creating categories.
Modified Final Designs
Worklows and mockups below have been slightly modified to show ONLY relavent mockups created by myself, and to remove any sensitive information and interactions pertaining to the other parts of the product.
Drag and Drop
A fundamentally new interaction that previously didn’t exist in the design system.
Adding Events
Below are snippets of the adding events to an event category.
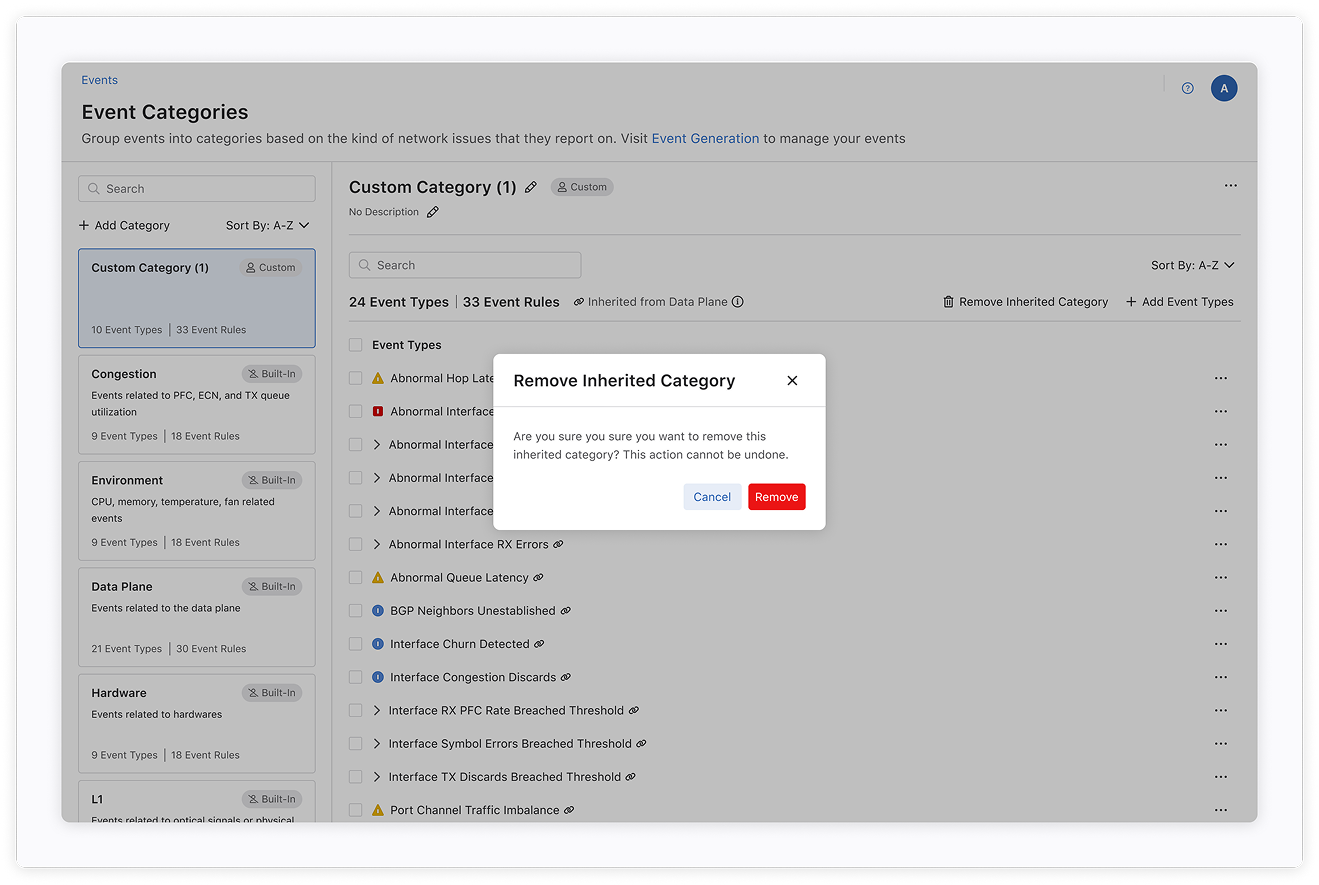
Confirmation to remove an inherited Category